The Dallas-Fort Worth metro area grew by 1.1 million since 2010, contributing nearly a third of the state’s total population growth during this same period. With a population of 7.5 million, that means more than a quarter of Texans call the DFW metro area home.
Facts & Stats
Demographics
Texas and specifically Fort Worth are experiencing significant growth.
In fact, Fort Worth is the fastest growing among the 20 largest U.S. cities and is expected to add another 600,000 by 2040. But that growth is about more than just population. Fort Worth has seen strong advances in education, jobs, diversity of culture and industry that have created an unmatched pool of resources for business to grow as well.
Fort Worth
Demographics
Fort Worth population
895,008
as of 07/01/18
Population growth up
20.2%
since April 1, 2010
Total civilian labor force
67.4%
2014-2018
Population
Growth
Select States Comparison
| State | 2000 | 2010 | 2018 | Difference | % |
|---|---|---|---|---|---|
| United States | 281,421,906 | 308,745,538 | 327,167,434 | 18,409,329 | 6% |
| Texas | 20,851,820 | 25,145,561 | 28,701,845 | 3,555,731 | 14% |
| California | 33,871,648 | 37,253,956 | 39,557,045 | 2,302,522 | 6% |
| Florida | 15,982,378 | 18,801,310 | 21,299,325 | 2,494,745 | 13% |
| Georgia | 8,186,453 | 9,687,653 | 10,519,475 | 830,766 | 9% |
| North Carolina | 8,049,313 | 9,535,483 | 10,383,620 | 847,884 | 9% |
| Washington | 5,894,121 | 6,724,540 | 7,535,591 | 811,051 | 12% |
| Arizona | 5,130,632 | 6,392,017 | 7,171,646 | 779,358 | 12% |
| Colorado | 5,029,196 | 5,029,196 | 5,695,564 | 666,248 | 13% |
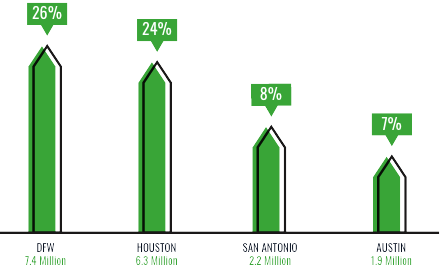
Largest Texas Metropolitan Regions
texas population 2020
29.15Million
DFW and Houston each represent about 1 in 4 residents, together accounting for half of Texas’ population.
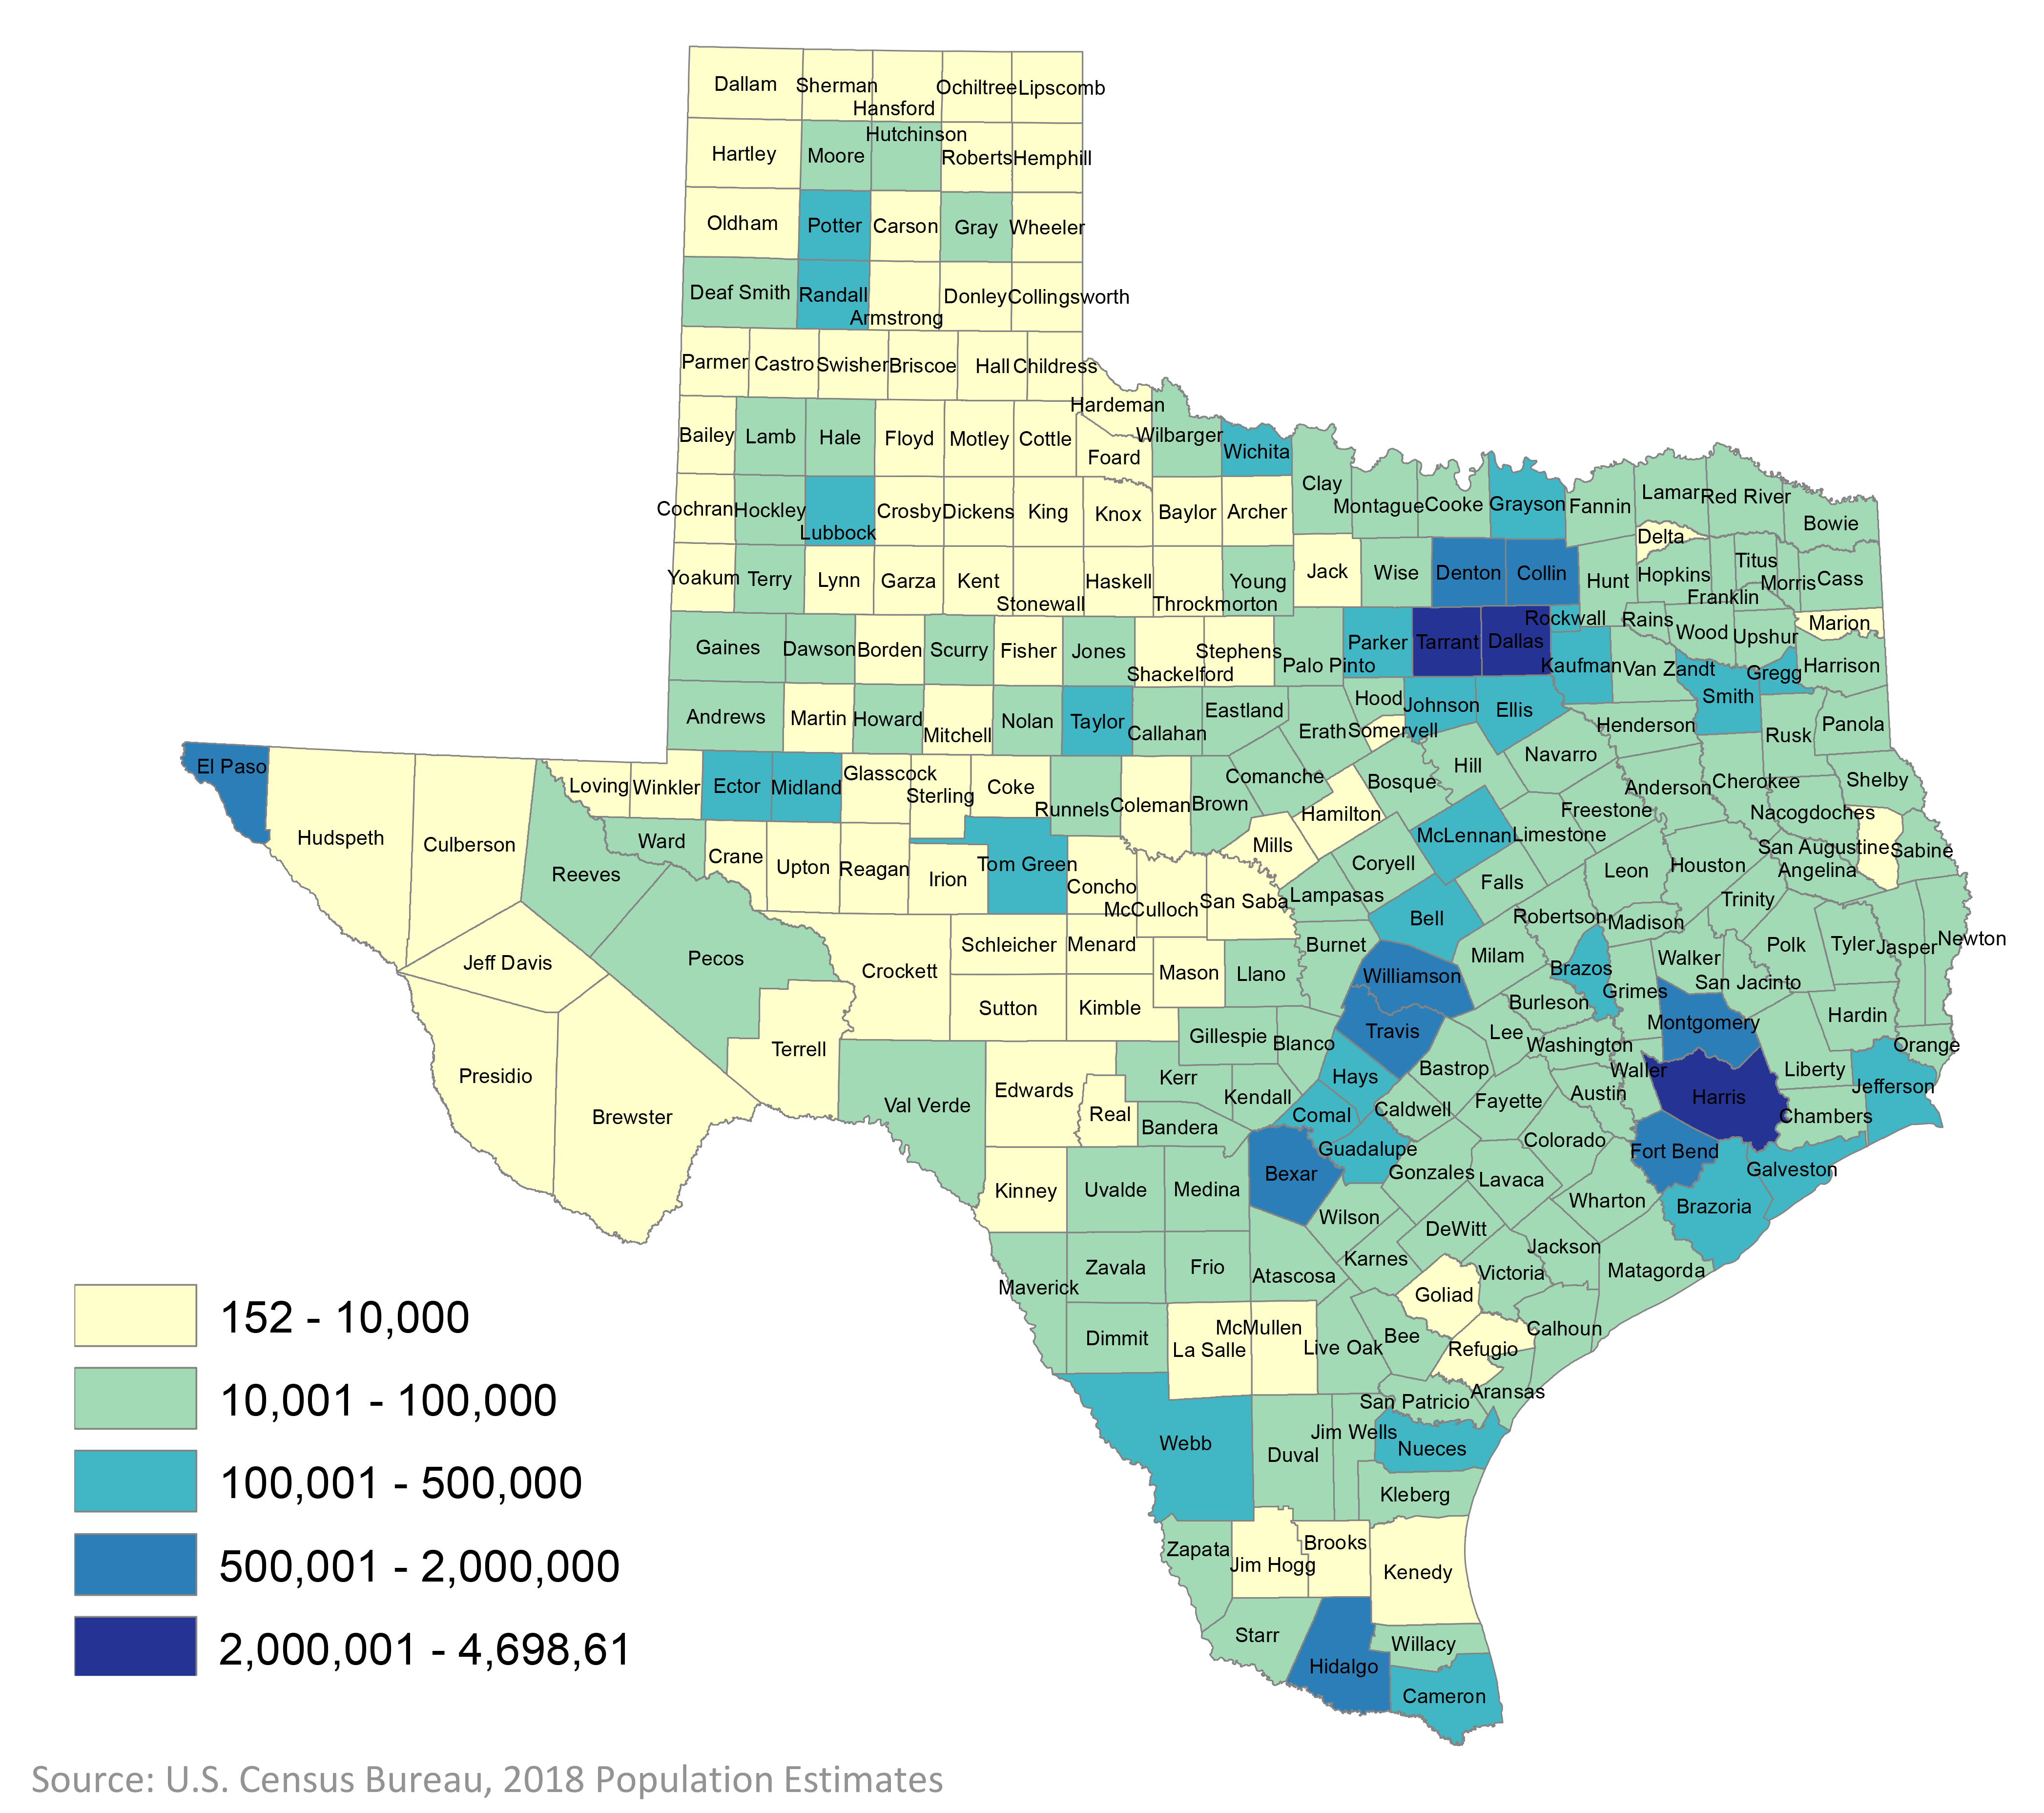
Estimated Population by County, 2018
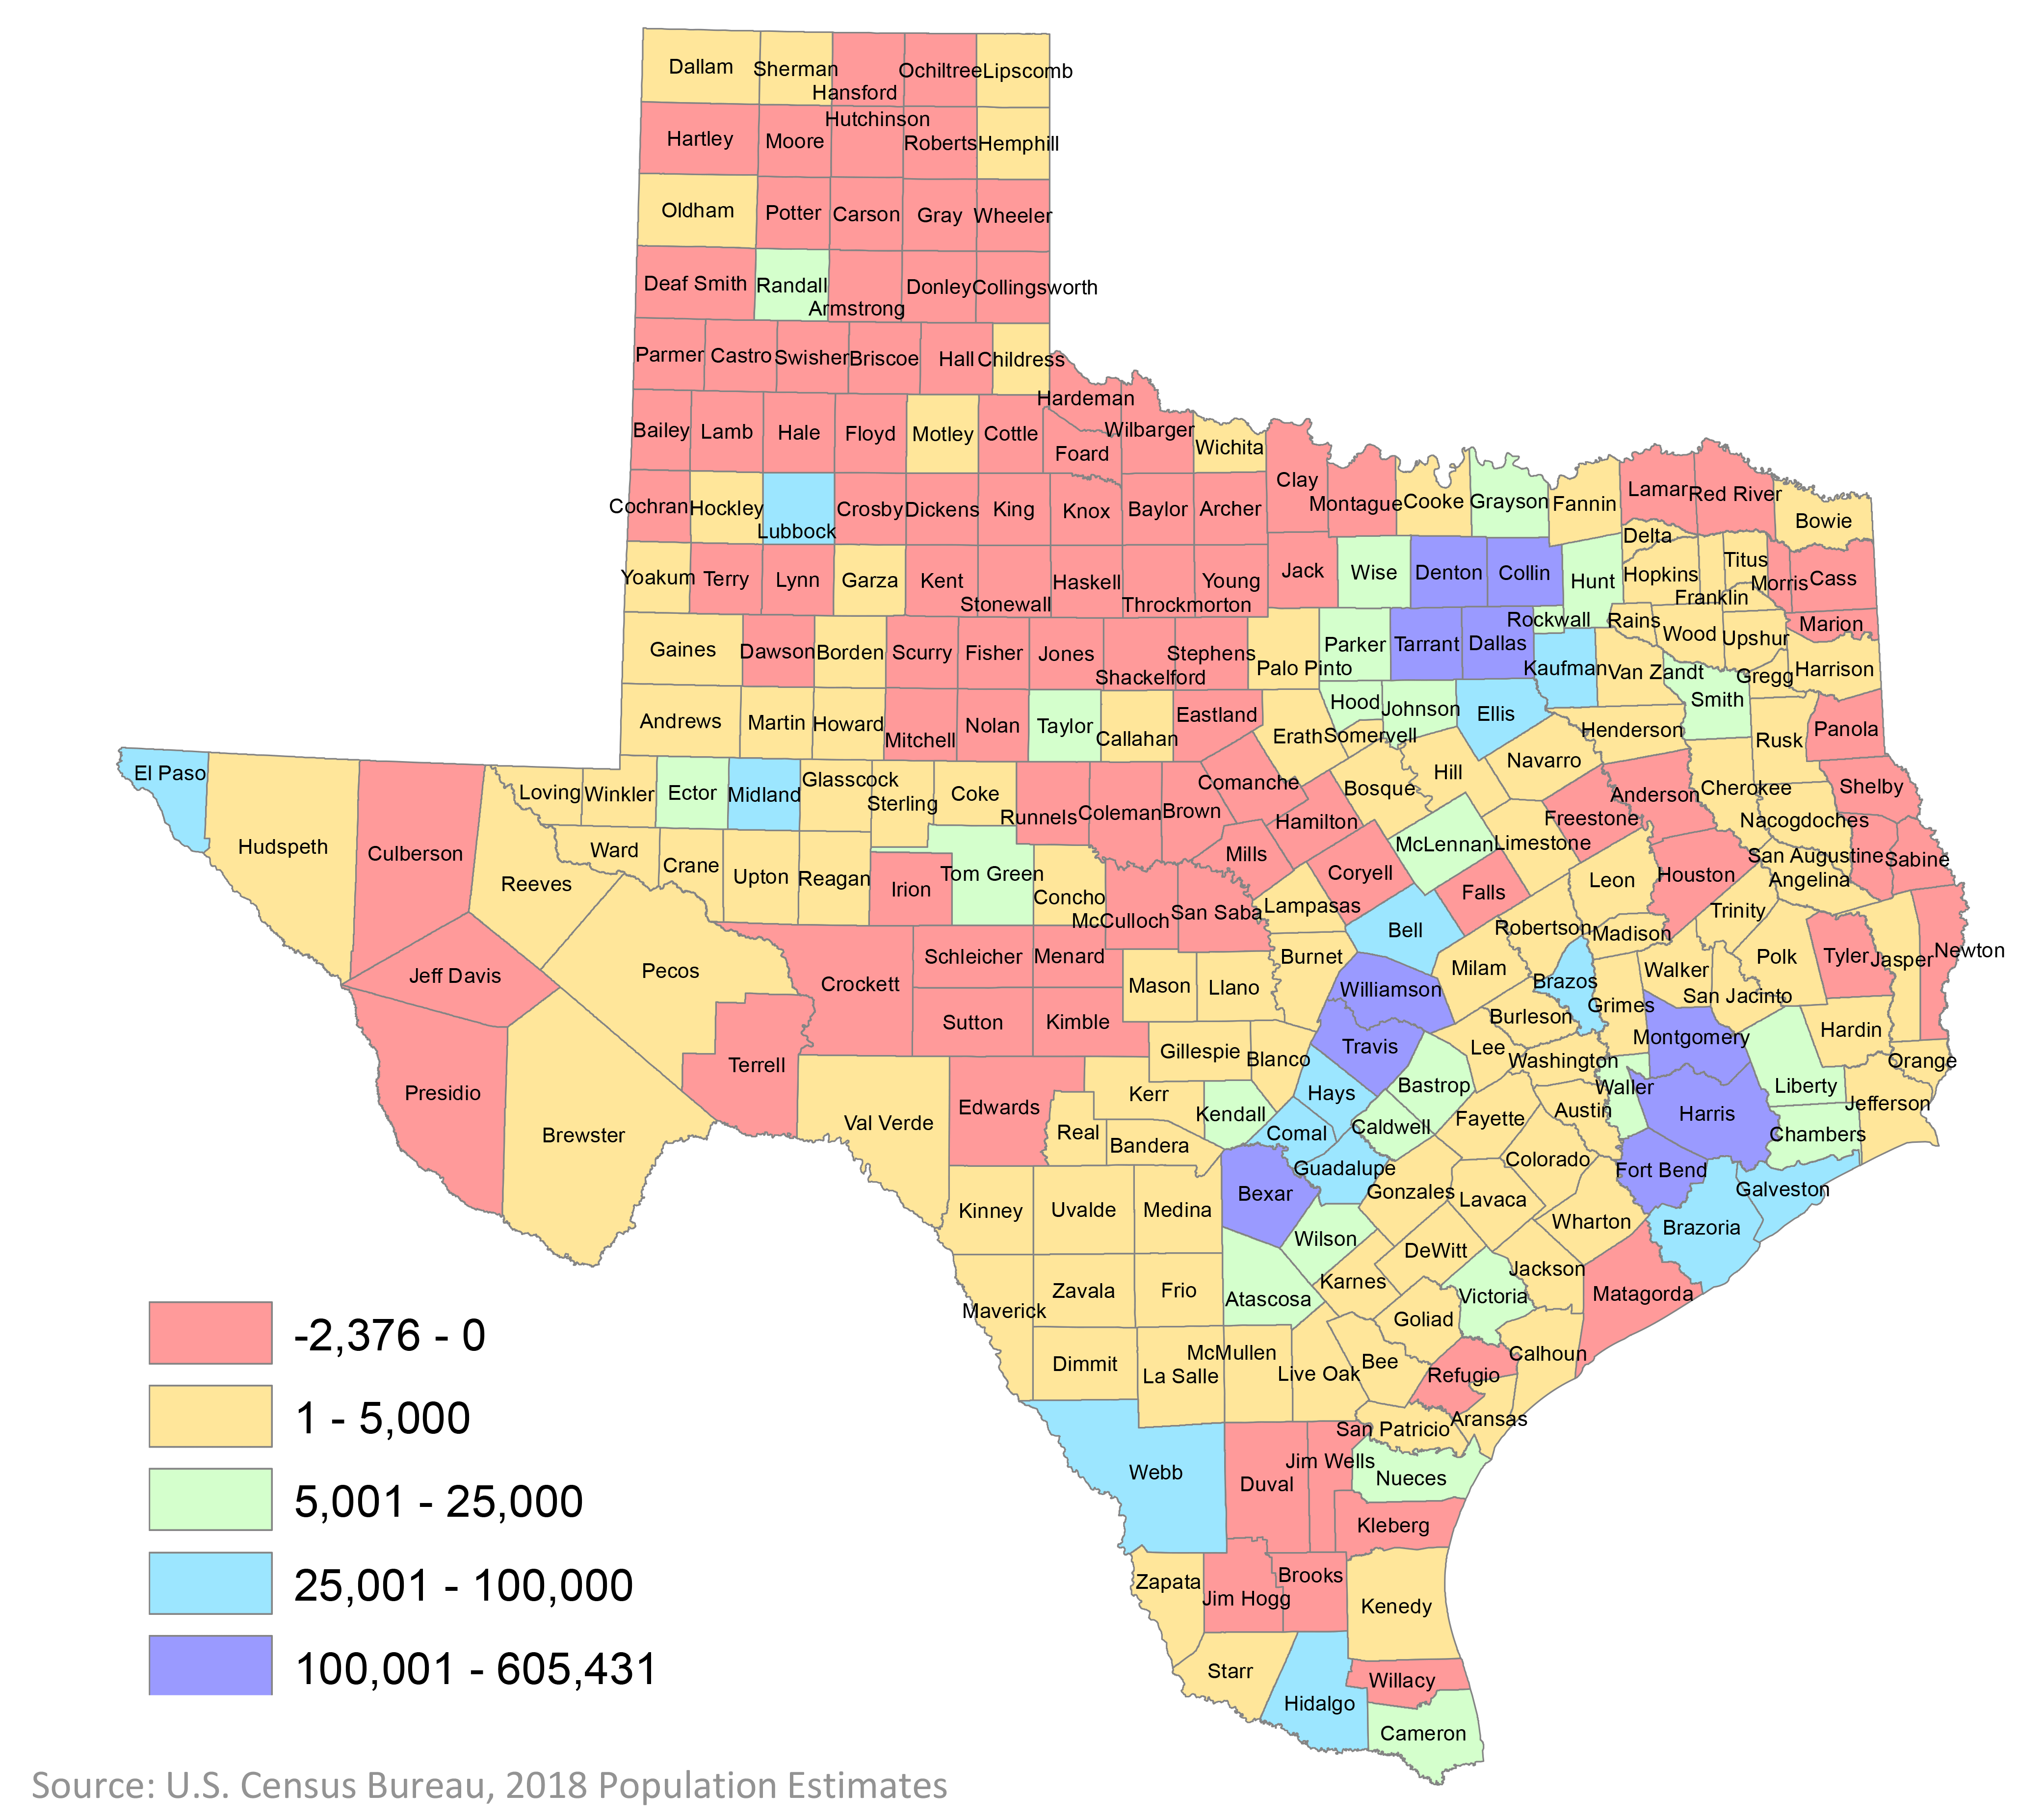
Domestic and Internal Migration Flow
Top 10 Metros in Numeric Growth 2010 to 2018
| Rank | Name | 2010 | 2018 | Annual Average Growth |
|---|---|---|---|---|
| 1 | Dallas-Fort Worth-Arlington, TX | 6,426,222 | 7,539,711 | 2.0% |
| 2 | Houston-The Woodlands-Sugar Land, TX | 5,920,487 | 6,997,384 | 2.1% |
| 3 | Phoenix-Mesa-Scottsdale, AZ | 4,193,127 | 4,857,962 | 1.7% |
| 4 | Atlanta-Sandy Springs-Rosewell, GA | 5,286,750 | 5,949,951 | 1.4% |
| 5 | Miami-Fort Lauderdale-West Palm Beach, FL | 5,566,294 | 6,198,782 | 1.3% |
| 6 | Washington-Arlington-Alexandria, DC-VA-MD-WV | 5,636,363 | 6,249,950 | 1.4% |
| 7 | Seattle-Tacoma-Bellevue, WA | 3,439,805 | 3,939,363 | 1.6% |
| 8 | Los Angeles-Long Beach-Anaheim, CA | 12,828,946 | 13,291,486 | 0.5% |
| 9 | Austin-Round Rock, TX | 1,716,321 | 2,168,316 | 2.9% |
| 10 | Orlando-Kissimmee-Sanford, FL | 2,134,402 | 2,572,962 | 2.1% |
Economic Indicators, Fort Worth
Unemployment Rate
Fort Worth’s economy and consumer market are strong. The unemployment rate in the Fort Worth Region is 3%, which is lower than the national average and the state of Texas.
Median Household Income
The Fort Worth region’s median household income of $59,255 is above the national average and the state of Texas. This, combined with the affordable cost of living gives consumers more buying power.
Median Age
Fort Worth’s median age is 32.2 – lower than Austin, Chicago, Nashville and Atlanta. Our diverse and talented workforce is a prime attraction for businesses relocating to the area.
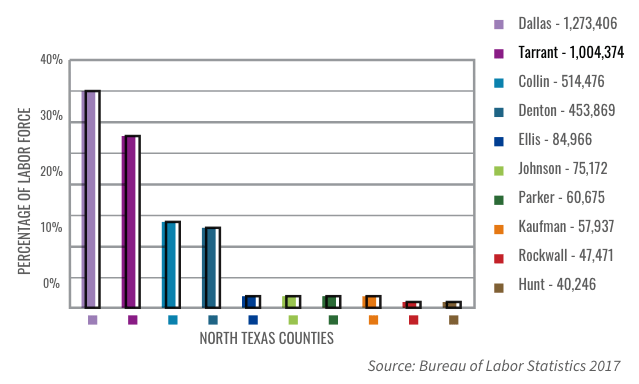
28%Tarrant County
28% of the North Texas regional labor force is represented by Tarrant County where Fort Worth is located.
Ethnicity in
Fort Worth
| Ethnicity | Percentage |
|---|---|
| White alone, not Hispanic or Latino | 39.5% |
| Hispanic or Latino (b) | 35.0% |
| Black or African American Alone (a) | 19.0% |
| Asian alone (a) | 4.2% |
| American Indian or Alaska Native alone (a) | 0.5% |
| Native Hawaiian and Other Pacific islander alone (a) | 0.1% |
| Two or More Races | 3.3% |
(b) Hispanics may be of any race, so also are included in applicable race categories - U.S. Census Bureau